
In an increasingly competitive streaming market, platforms like Disney+ and Netflix constantly strive to differentiate themselves and appeal to their target audiences. Many view Disney+ as a family-friendly platform catering primarily to children and young viewers, while Netflix projects itself as a platform with a diverse range of content, including a significant focus on adult audiences. However, these perceptions often overlook the full diversity of content on each platform, especially with Disney+’s inclusion of franchises like Marvel and Star Wars, which attract viewers across age groups.
Understanding the actual differences in content offers valuable insights for various stakeholders. For instance, industry analysts and marketers use this knowledge to refine audience segmentation strategies, while consumers identify which platform aligns more closely with their preferences. Additionally, comparing the quality of content, measured by critical reception (e.g., Rotten Tomatoes scores), highlights whether these platforms differ in their ability to produce or host critically acclaimed movies.
By analyzing the age restrictions and Rotten Tomatoes scores of movies available on Disney+ and Netflix, we aim to answer two key questions:
This analysis addresses two central research questions: Age Restrictions: Are movies on Disney+ generally aimed at younger audiences compared to those on Netflix? This question examines whether the perception of Disney+ as a platform predominantly for children and families holds true when compared to Netflix, which is often seen as catering to a broader and more mature audience. Quality of Movies: Is there a difference in the critical reception of movies on Netflix and Disney+, as measured by Rotten Tomatoes scores? This question explores whether the overall quality of movies, based on audience and critic ratings, differs between the two platforms, helping to clarify whether one platform consistently offers more critically acclaimed content.
The data set contains information about movies available on Disney+ and Netflix, with the following key variables: Platform: A binary variable indicating the streaming service distributed along two columns for both platforms(Disney+ or Netflix). Age Restriction: A categorical variable reflecting the movie’s age classification. These categories follow standard film rating systems, indicating the appropriateness of the movie for different age groups. The given data was classified based on age category and after a primary research, I was able to put it under several categories which are X(18+), PG(7+), PG-13(13+), R(16+) and G(all). (Wikipedia (2024)) Rotten Tomatoes Score: A continuous variable representing the critical and audience reception of the movie, expressed as a percentage (0–100). Higher scores indicate better reception. (Tomatoes(2024)) Other Variables: Additional metadata such as title or release year may also be included but are secondary to the analysis.
The data will be analyzed in two steps: A descriptive analysis will summarize the dataset and provide insights into the distributions of age restrictions and Rotten Tomatoes scores across the two platforms. Statistical hypothesis tests will be conducted to determine whether the observed differences in age restrictions and scores are statistically significant. This structured approach will allow for a comprehensive understanding of the differences (if any) between the two platforms, moving beyond anecdotal perceptions to evidence-based conclusions.
The statistical analysis and report writing for this project were conducted using R, a powerful language and environment for statistical computing and graphics.(R Core Team (2023)) The following R packages were utilized to streamline data processing, analysis, visualization, and report generation: tidyverse(Wickham et al. (2019)), lubridate(Grolemund and Wickham (2011)), reshape2(Wickham (2007)), waffle(Rudis and Gandy (2023)), gt(Iannone et al. (2024)), gtExtras(Mock (2023)), kableExtra(Zhu (2024)), scales(Wickham, Pedersen, and Seidel (2023)), rcompanion(Mangiafico (2024)), hrbrthemes(Rudis (2024)), viridis(Garnier et al. (2024))
To address the two research questions, we employ a combination of descriptive and inferential statistical methods. Below is a detailed description of the methods used, along with their mathematical foundations.
This step provides a summary of the data to understand the general trends and patterns.
Objective: Test whether there is a difference in Rotten Tomatoes scores between the two platforms. Approach: Since Rotten Tomatoes scores are continuous, we first test for normality using the Shapiro-Wilk Test: An adaptation of the Shapiro–Wilk W test to the case of normality with a known mean is considered. The table of critical values for different sample sizes and several significance levels is given. The power of the test is investigated and compared with the Kolmogorov test and the two-step procedure consisting of the Shapiro–Wilk W and t tests. Additionally, the normalizing coefficients for the test statistic are given. (Hanusz, Tarasinska, and Zielinski (2016))
\[ W = \frac{\left(\sum_{i=1}^{n} a_i x^{(i)}\right)^2} {\sum_{i=1}^{n} \left(x_i - \bar{x}\right)^2} \]
Where 𝑥i are the ordered data, and 𝑎i are constants derived from expected normal order statistics. Based on the normality results:
If normal, use a two-sample t-test (Cressie and Whitford (1986)):
\[ t = \frac{\bar{x}_1 - \bar{x}_2} {\sqrt{\frac{s_1^2}{n_1} + \frac{s_2^2}{n_2}}} \]
Where: \[\bar{x}_1, \bar{x}_2: Sample means. {s_1^2}, {s_2^2}: Sample variances. {𝑛_1}, {𝑛_2}: Sample sizes\]
If not normal, use the Mann-Whitney U Test: The Mann-Whitney U test, which is also known as the Wilcoxon rank sum test, tests for differences between two groups on a single, ordinal variable with no specific distribution (Mann & Whitney, 1947; Wilcoxon, 1945). In contrast, the independent samples t-test, which is also a test of two groups, requires the single variable to be measured at the interval or ratio level, rather than the ordinal level, and to be normally distributed. We accordingly refer to the Mann-Whitney U test as the nonparametric version of the parametric t-test. Both tests require two independently sampled groups and assess whether two groups differ on a single, continuous variable. The two tests, however, differ on the assumed distribution. A nonparametric test assumes no specific distribution, whereas a parametric test assumes a specific distribution. Thus, the Mann-Whitney U is conceptually similar to the t-test for determining whether two sampled groups are from a single population. When data do not meet the parametric assumptions of the t-test, the Mann-Whitney U tends to be more appropriate. (McKnight and Najab (2010)) Hypotheses: Null (𝐻0): The mean (or median) Rotten Tomatoes scores are equal for Disney+ and Netflix. Alternative (𝐻𝑎): The mean (or median) Rotten Tomatoes scores differ.
\[ U = n_1 n_2 + \frac{n_1(n_1 + 1)}{2} - R_1 \]
\[Where: {𝑛_1}, {𝑛_2}: Sample sizes of Disney+ and Netflix. {𝑅_1}: Sum of ranks for Disney+ movies.\]
Decision Rule: Compare 𝑈 to a critical value or calculate the p-value. If 𝑝 < 𝛼 (e.g.,𝛼 = 0.05), reject 𝐻0.
Each statistical test is based on specific assumptions:
To provide a visual representation of age restrictions across Disney+ and Netflix, we used a waffle chart. Each cell in the chart represents a specific percentage of the total movies available on each platform, categorized by age ratings (e.g., G, PG, PG-13, R and X). This helps highlight the proportional differences in age restrictions between the platforms
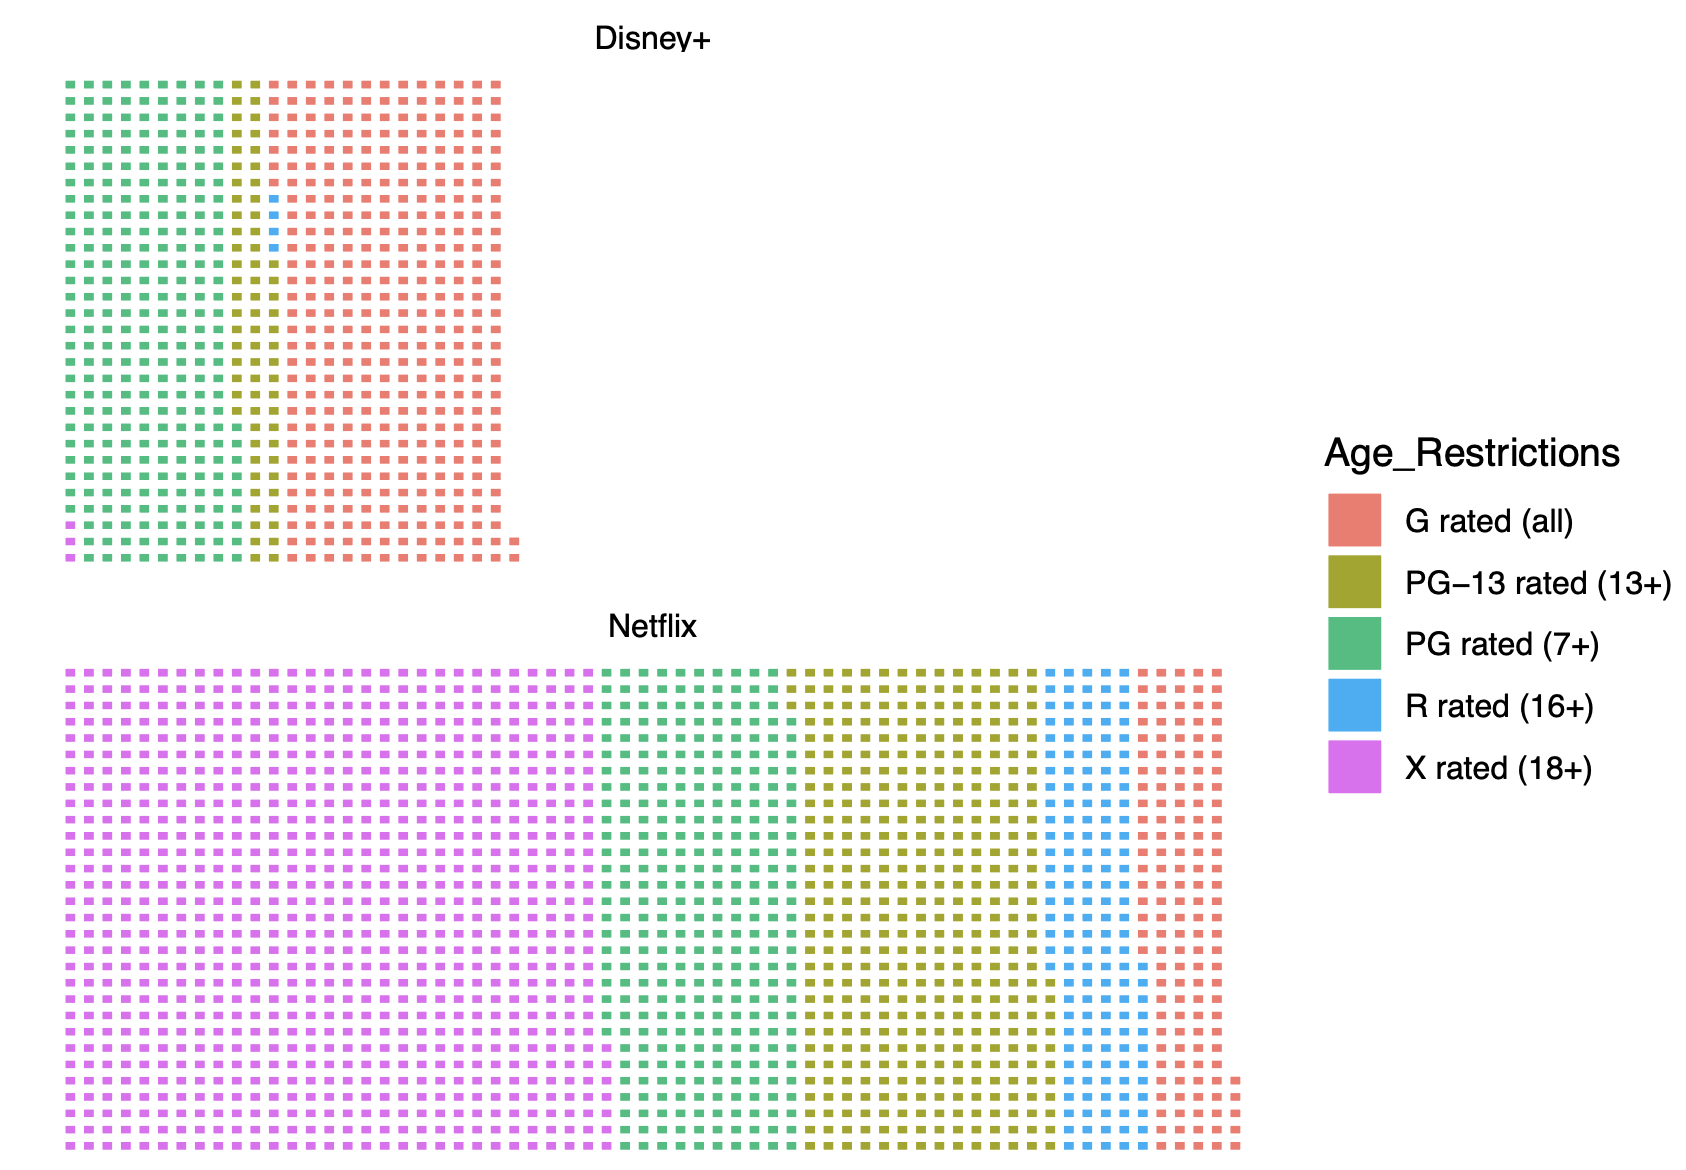
To quantify the findings from the waffle chart, we created a frequency table to compare the count and percentage of movies under each age rating for both platforms.
| Age Restriction | Disney | Netflix |
|---|---|---|
| G rated (all) | 369 | 143 |
| PG 13 rated (13+) | 70 | 404 |
| PG rated (7+) | 276 | 320 |
| R rated (16+) | 4 | 151 |
| X rated (18+) | 3 | 877 |
To better understand the differences in Rotten Tomatoes ratings between Disney+ and Netflix, we first calculated the mean, median, standard deviation, and variance for the Rotten Tomatoes scores of movies on both platforms. These statistics help summarize the central tendency and dispersion of the ratings, allowing us to assess the overall quality of movies available on each platform.
| Summary | Disney | Netflix |
|---|---|---|
| Mean Ratings | 60.5 | 61.7 |
| Median Ratings | 60.0 | 61.0 |
| Standard Deviation | 12.8 | 13.0 |
| Variance | 164.2 | 168.9 |
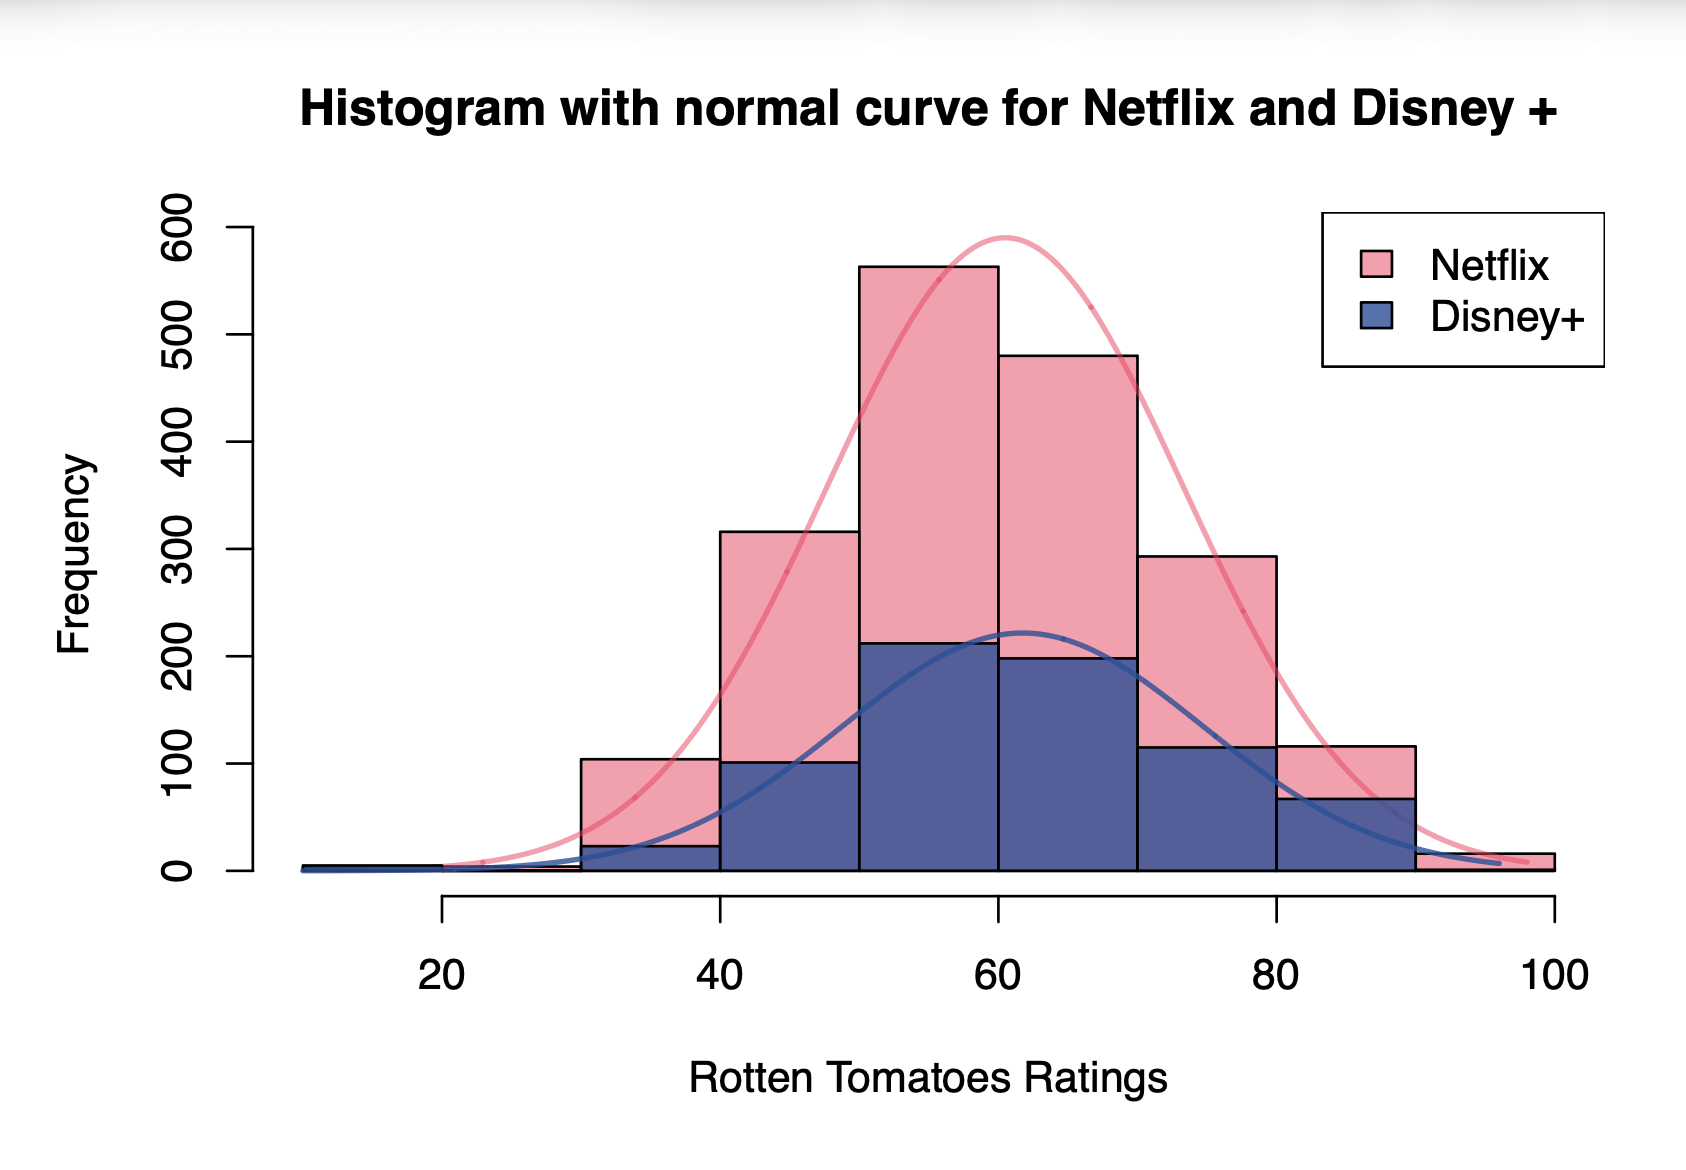
To visualize the distribution of Rotten Tomatoes scores for movies on both platforms, we created a histogram with overlaid normal distribution curves. This chart provides insight into the shape of the distributions and allows us to observe any skewness or outliers.
The test results showed:
Since both platforms’ data deviates from normality, we chose the Mann-Whitney U test, a non- parametric test, to compare the Rotten Tomatoes scores between Disney+ and Netflix.
The hypothesis test for Rotten Tomatoes scores on both platforms was formulated as follows:
Using the Mann-Whitney U test, we calculated the test statistic and the p-value. ## Test p_value ## 1 Mann-Whitney U test 0.02
The result showed a p-value of 0.02, which is less than the significance level of 0.05.Therefore, we reject the null hypothesis and conclude that there is a statistically significant difference in Rotten Tomatoes scores between Disney+ and Netflix.
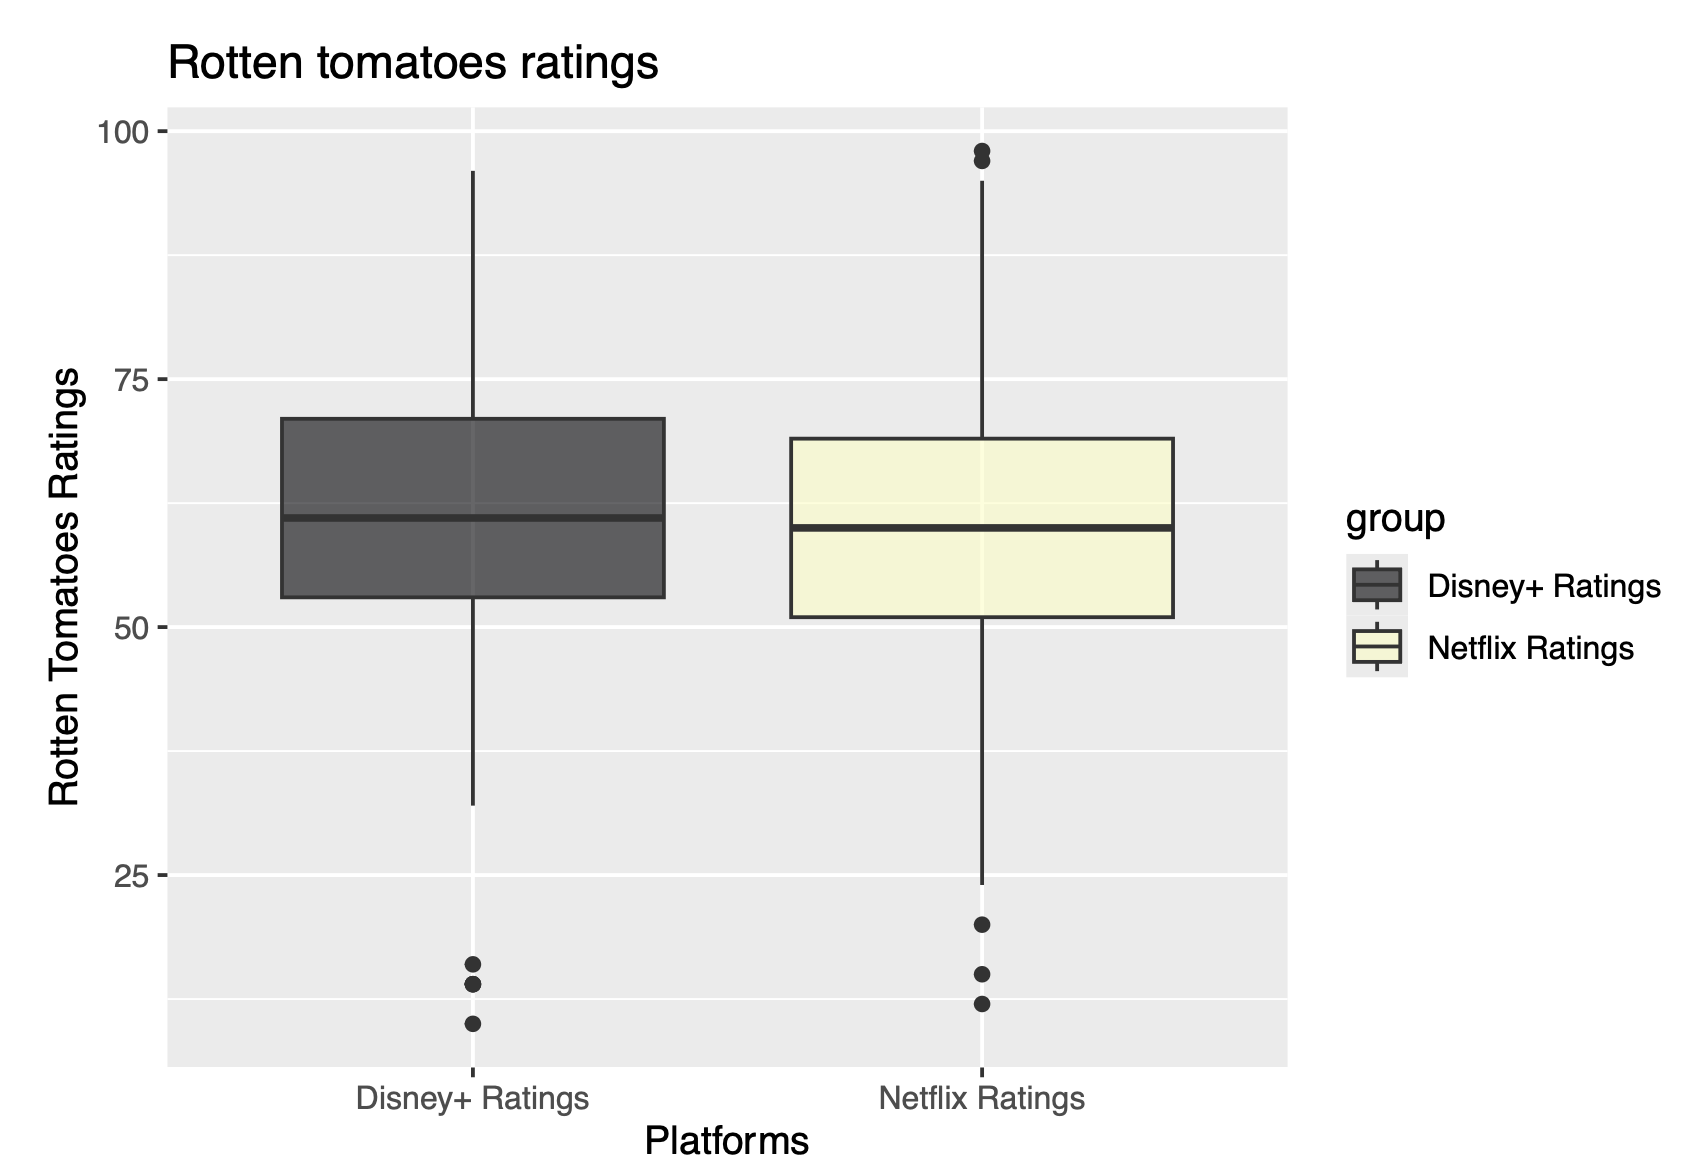
Finally, to visually confirm the findings from the statistical test, we used a box plot to display the distribution of Rotten Tomatoes scores for both platforms. The box plot provides a clear visual comparison of the central tendency, spread, and potential outliers in the data.
This analysis aimed to compare the content strategies of Disney+ and Netflix by investigating two key aspects: